The last few weeks have had me wearing my finance hat at work a fair amount, so it was through the glare of a green visor that I got to thinking about dollars-per-points. Every other keeper league that I have seen friends participate in involves some sort of salary cap or draft budget type scheme. I am not advocating for that at all, but it was enough to spark curiosity into how the KCKL teams do in terms of bang-for-buck and if a higher team payroll translates into greater success in our format.
In theory, a team with a low total payroll while achieving success is an indicator of a GM’s draft ability. Acknowledgement is deserved for uncovering those players who have been undervalued by NHL brass or spotting young guns on entry level deals before fellow KCKL front offices.
On the other hand, if it turns out that the higher the payroll the better the team, then forget it, there is no true skill to this and we should all just compare players based on NHL contract value when negotiating trades.
To track this I have created a “Dollar Efficiency Score” that compares your team’s payroll against your current standing in the league. Positive numbers mean you are outperforming, negative numbers indicate underperformance. These numbers won’t take into account the true gap between budgets, but will reflect a general indicator by way of ranked comparison (i.e. they will total 0 across all teams).
Note 1: Because of slippery agents and capologists, contracts can be formatted creatively. So I will use the AAV.
Note 2: Players not in the NHL will still be assigned their AAV as well – it is early in the season and, in theory, they could still be called up to the big club.
Note 3: I will calculate Scoring Rosters and standings exactly as Pickup Hockey has them the day I input the data. I am not sure how they determine a tie-break or for who gets counted in the SR and who is highlighted green with envy.
And with that, let’s see what the numbers have to say….
Best
Micahleks are dominating this category. They are currently squeezing out +12 efficiency from their Scoring Roster, the highest rating for any category.
Worst
Both the Fylanders and Rordiques are blowing through big cash to get underwhelming results from their Scoring Rosters at the moment….perhaps a coaching change would help get this expensive talent on track?
Having a bench full of dollar signs can be an indicator of a few different things.
1) Your team may be lacking entry-level contracts and thus short on youth (BAD)
2) You may have underperforming stars due for a correction (glass half full)…or just on bad contracts (glass half empty).
3) You have an incredibly outperforming Scoring Roster that has bumped down expensive talent (GOOD).
Best
The Moilers are sporting a very impressive +11 Efficiency Score while holding down 2nd overall in the league. But the Krupuls tie the above mentioned Micahleks +12 Efficiency while coming in nearly $12 million below the KL average. Way to pinch your pennies!
Worst
Swinging from one extreme to the other, the Stefans are busy warming their bench with Bordens at a -12 rating.
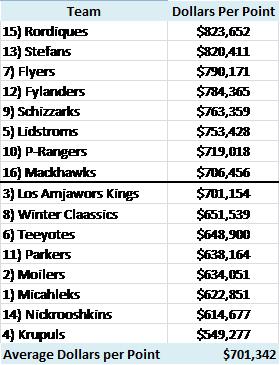
Now for the real fun. A look at how each team is performing versus their overall payroll.
Very interesting to see that both the Kings and the P-Rangers are right where they should be according to this analysis. The Krupuls continue to return their empties and are laughing their way into contention, while the Rordiques may want to investigate their Controller for embezzlement and the Nickrooshkins only operate the team for the tax write-offs.
These numbers may be better highlighted by looking at Dollars-per-Points
In Conclusion
The value of this analysis on our league is negligible, but what it does demonstrate is that NHL GM’s are assigning different values to players than we should. Obviously we are a points only league, so grit and stick-to-itiveness aren’t necessarily bumping up a player’s value in any of our eyes. What this analysis does demonstrate is that success can be found by identifying talent before NHL teams get a chance to back up the Brinks truck to their house.
I am interested to see if anyone can make any other findings with this data. If you have thoughts, put them in the comments!
I am interested to see if anyone can make any other findings with this data. If you have thoughts, put them in the comments!


Excellent post, better soundtrack.
ReplyDeleteGlad to see my Rordiques are finally ranked #1 in a category! I'll take what I can get.
ReplyDelete